Hogsten
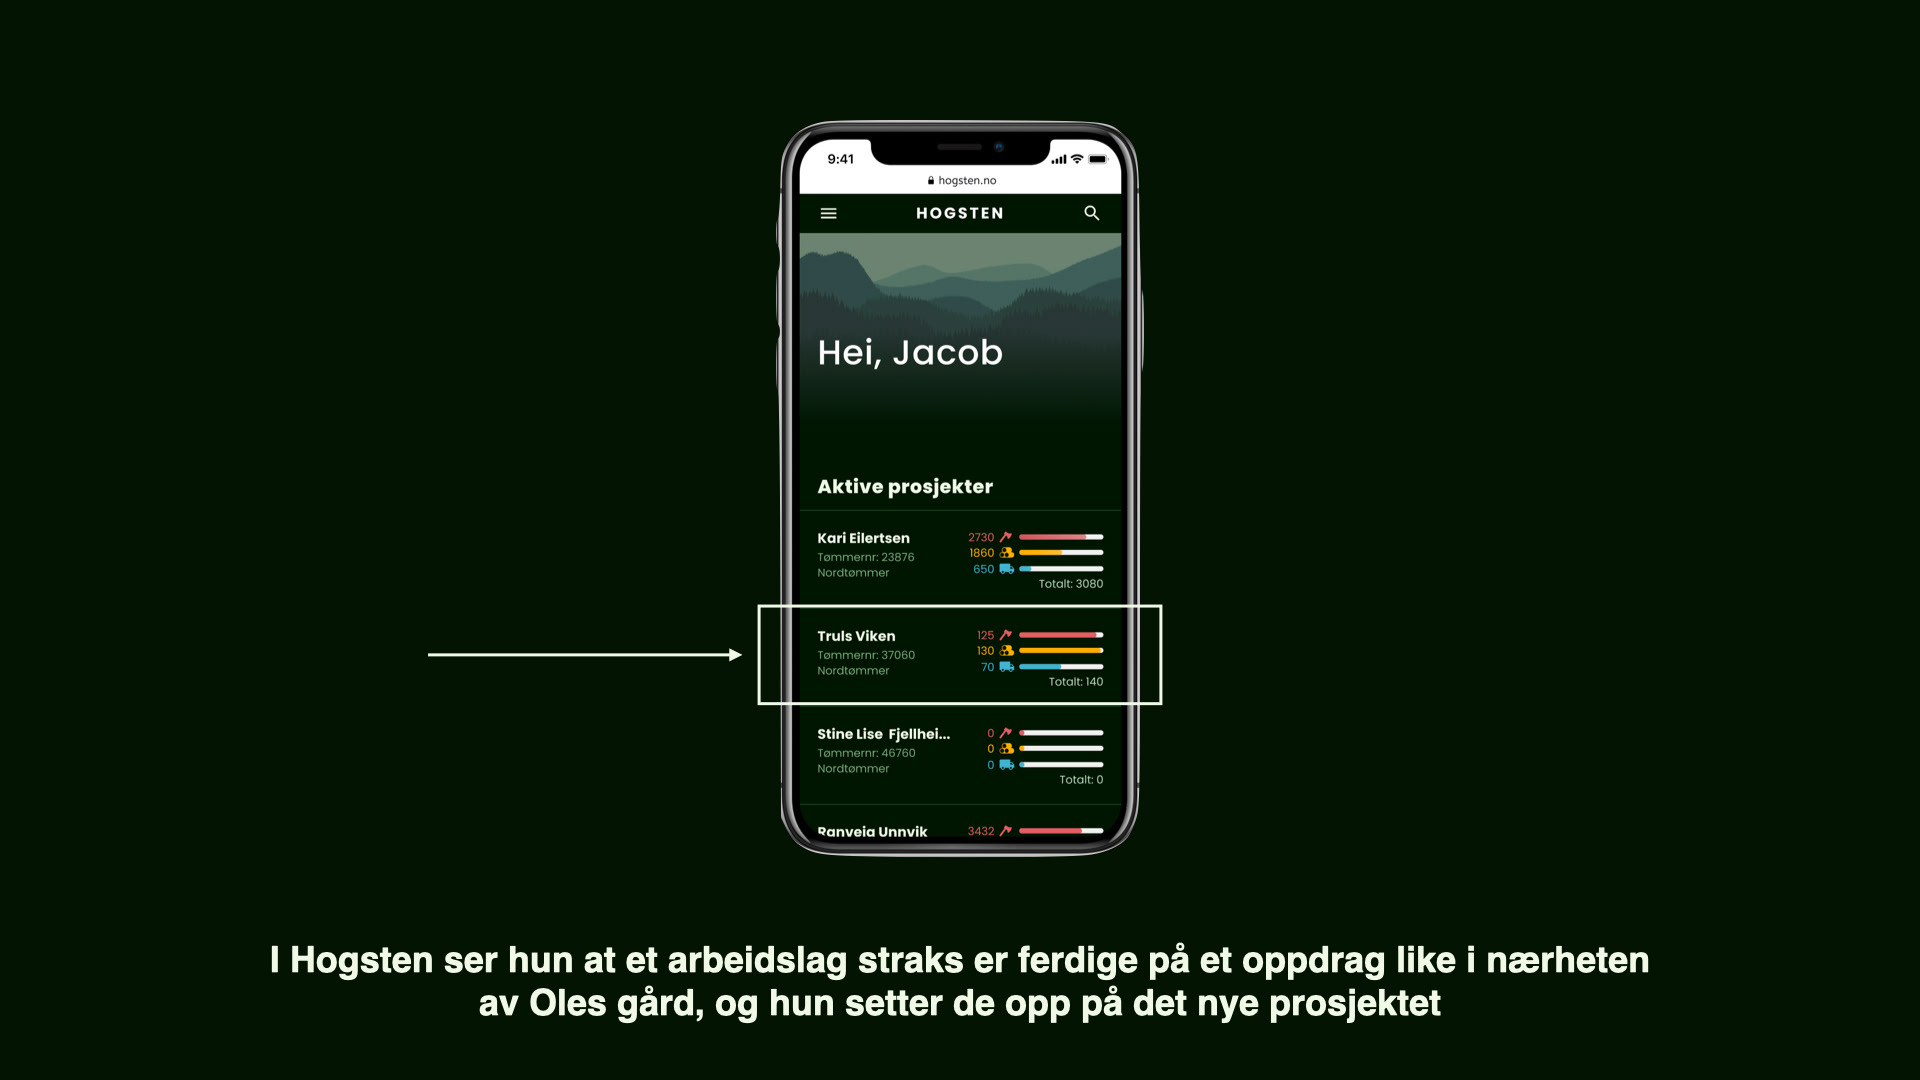
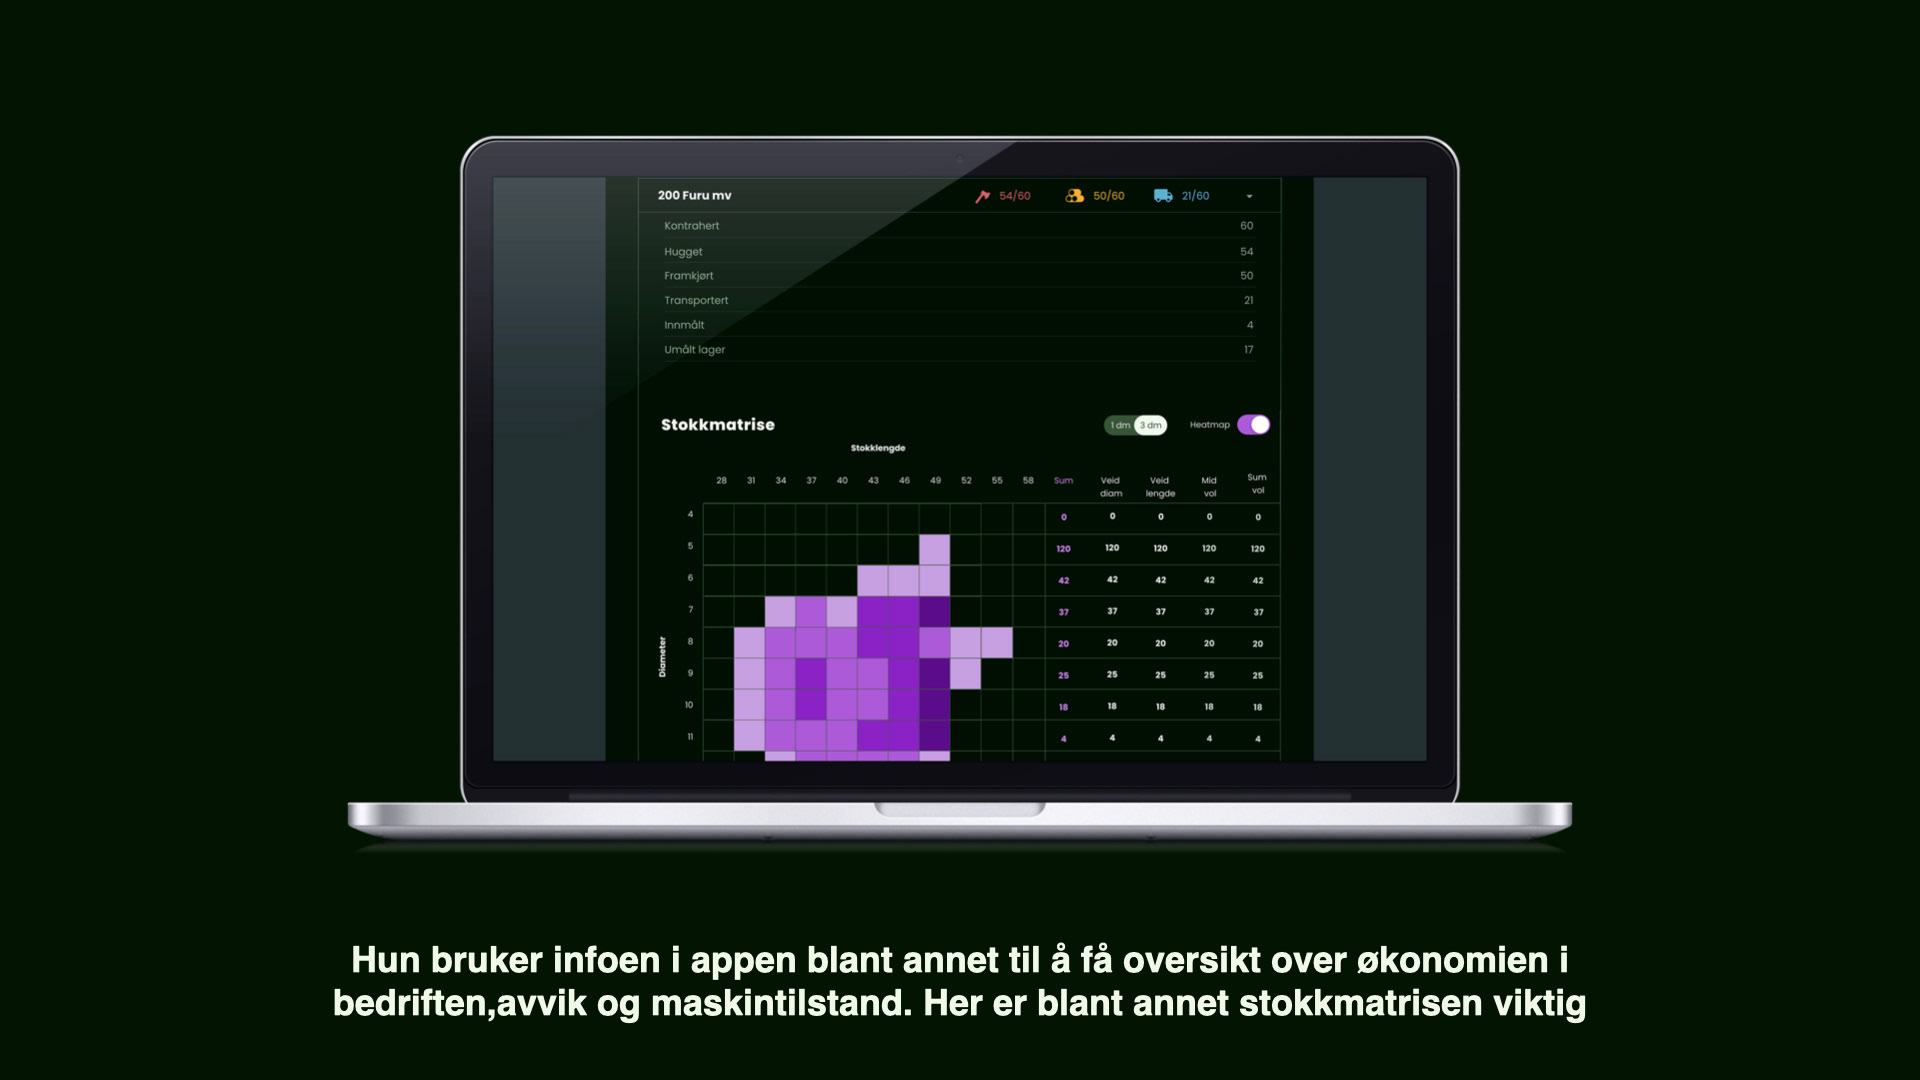
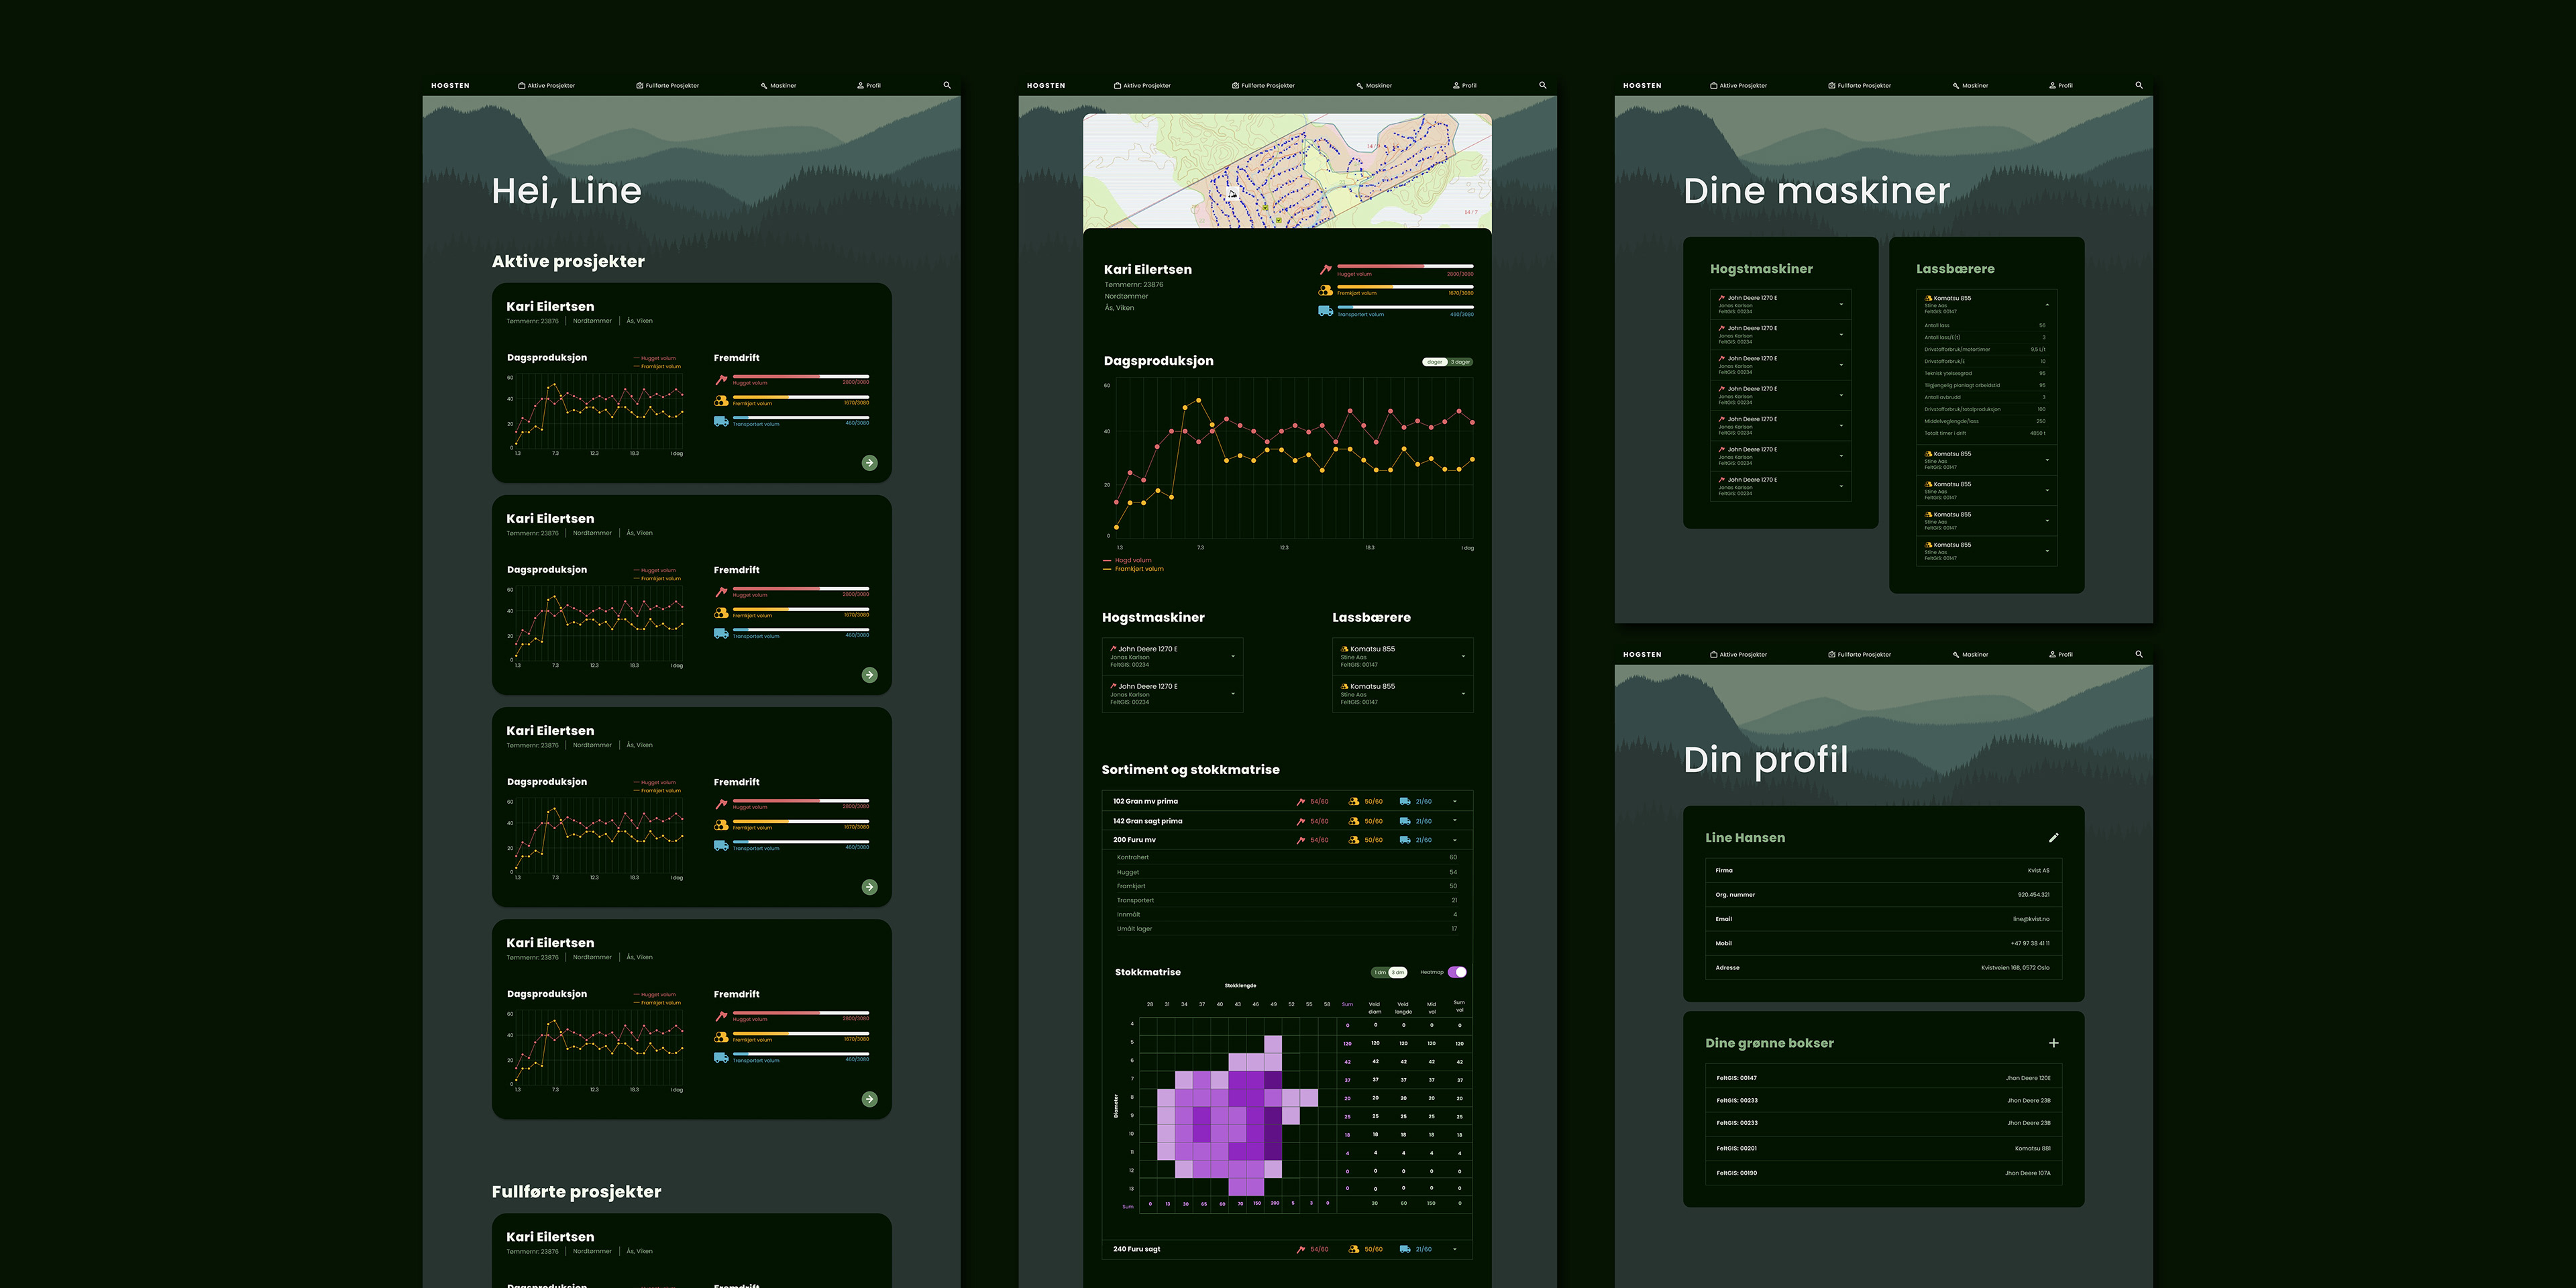
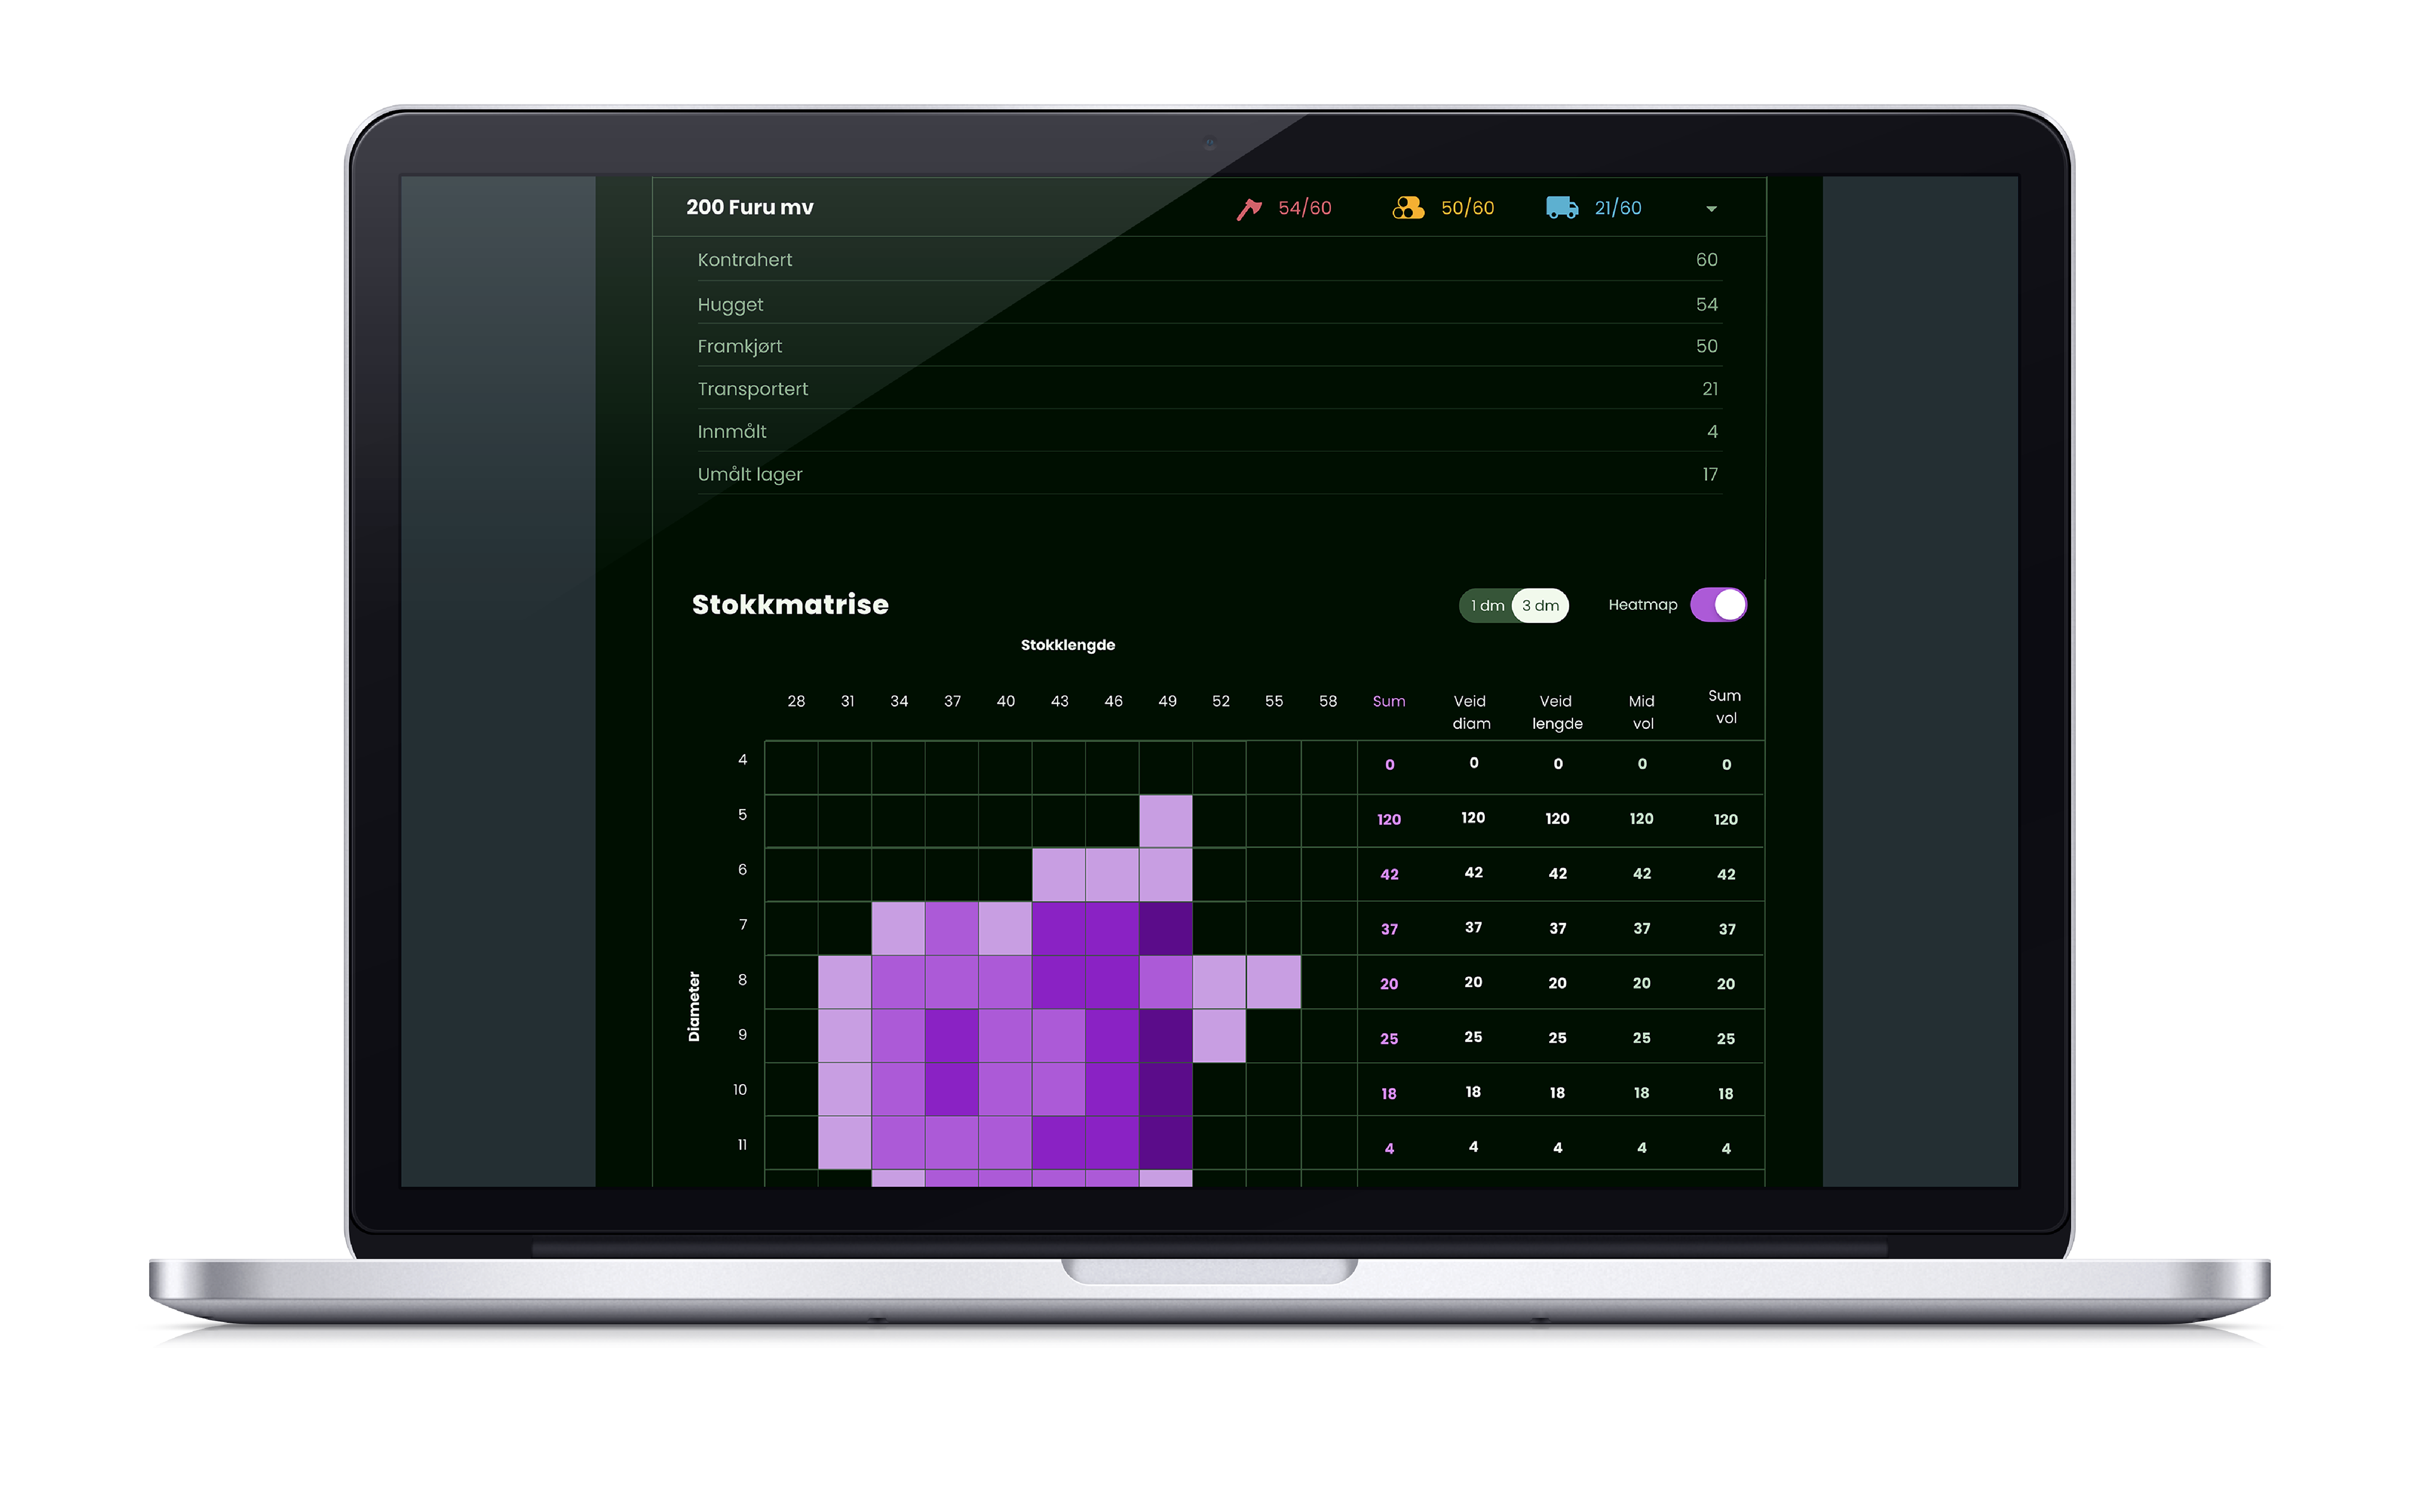
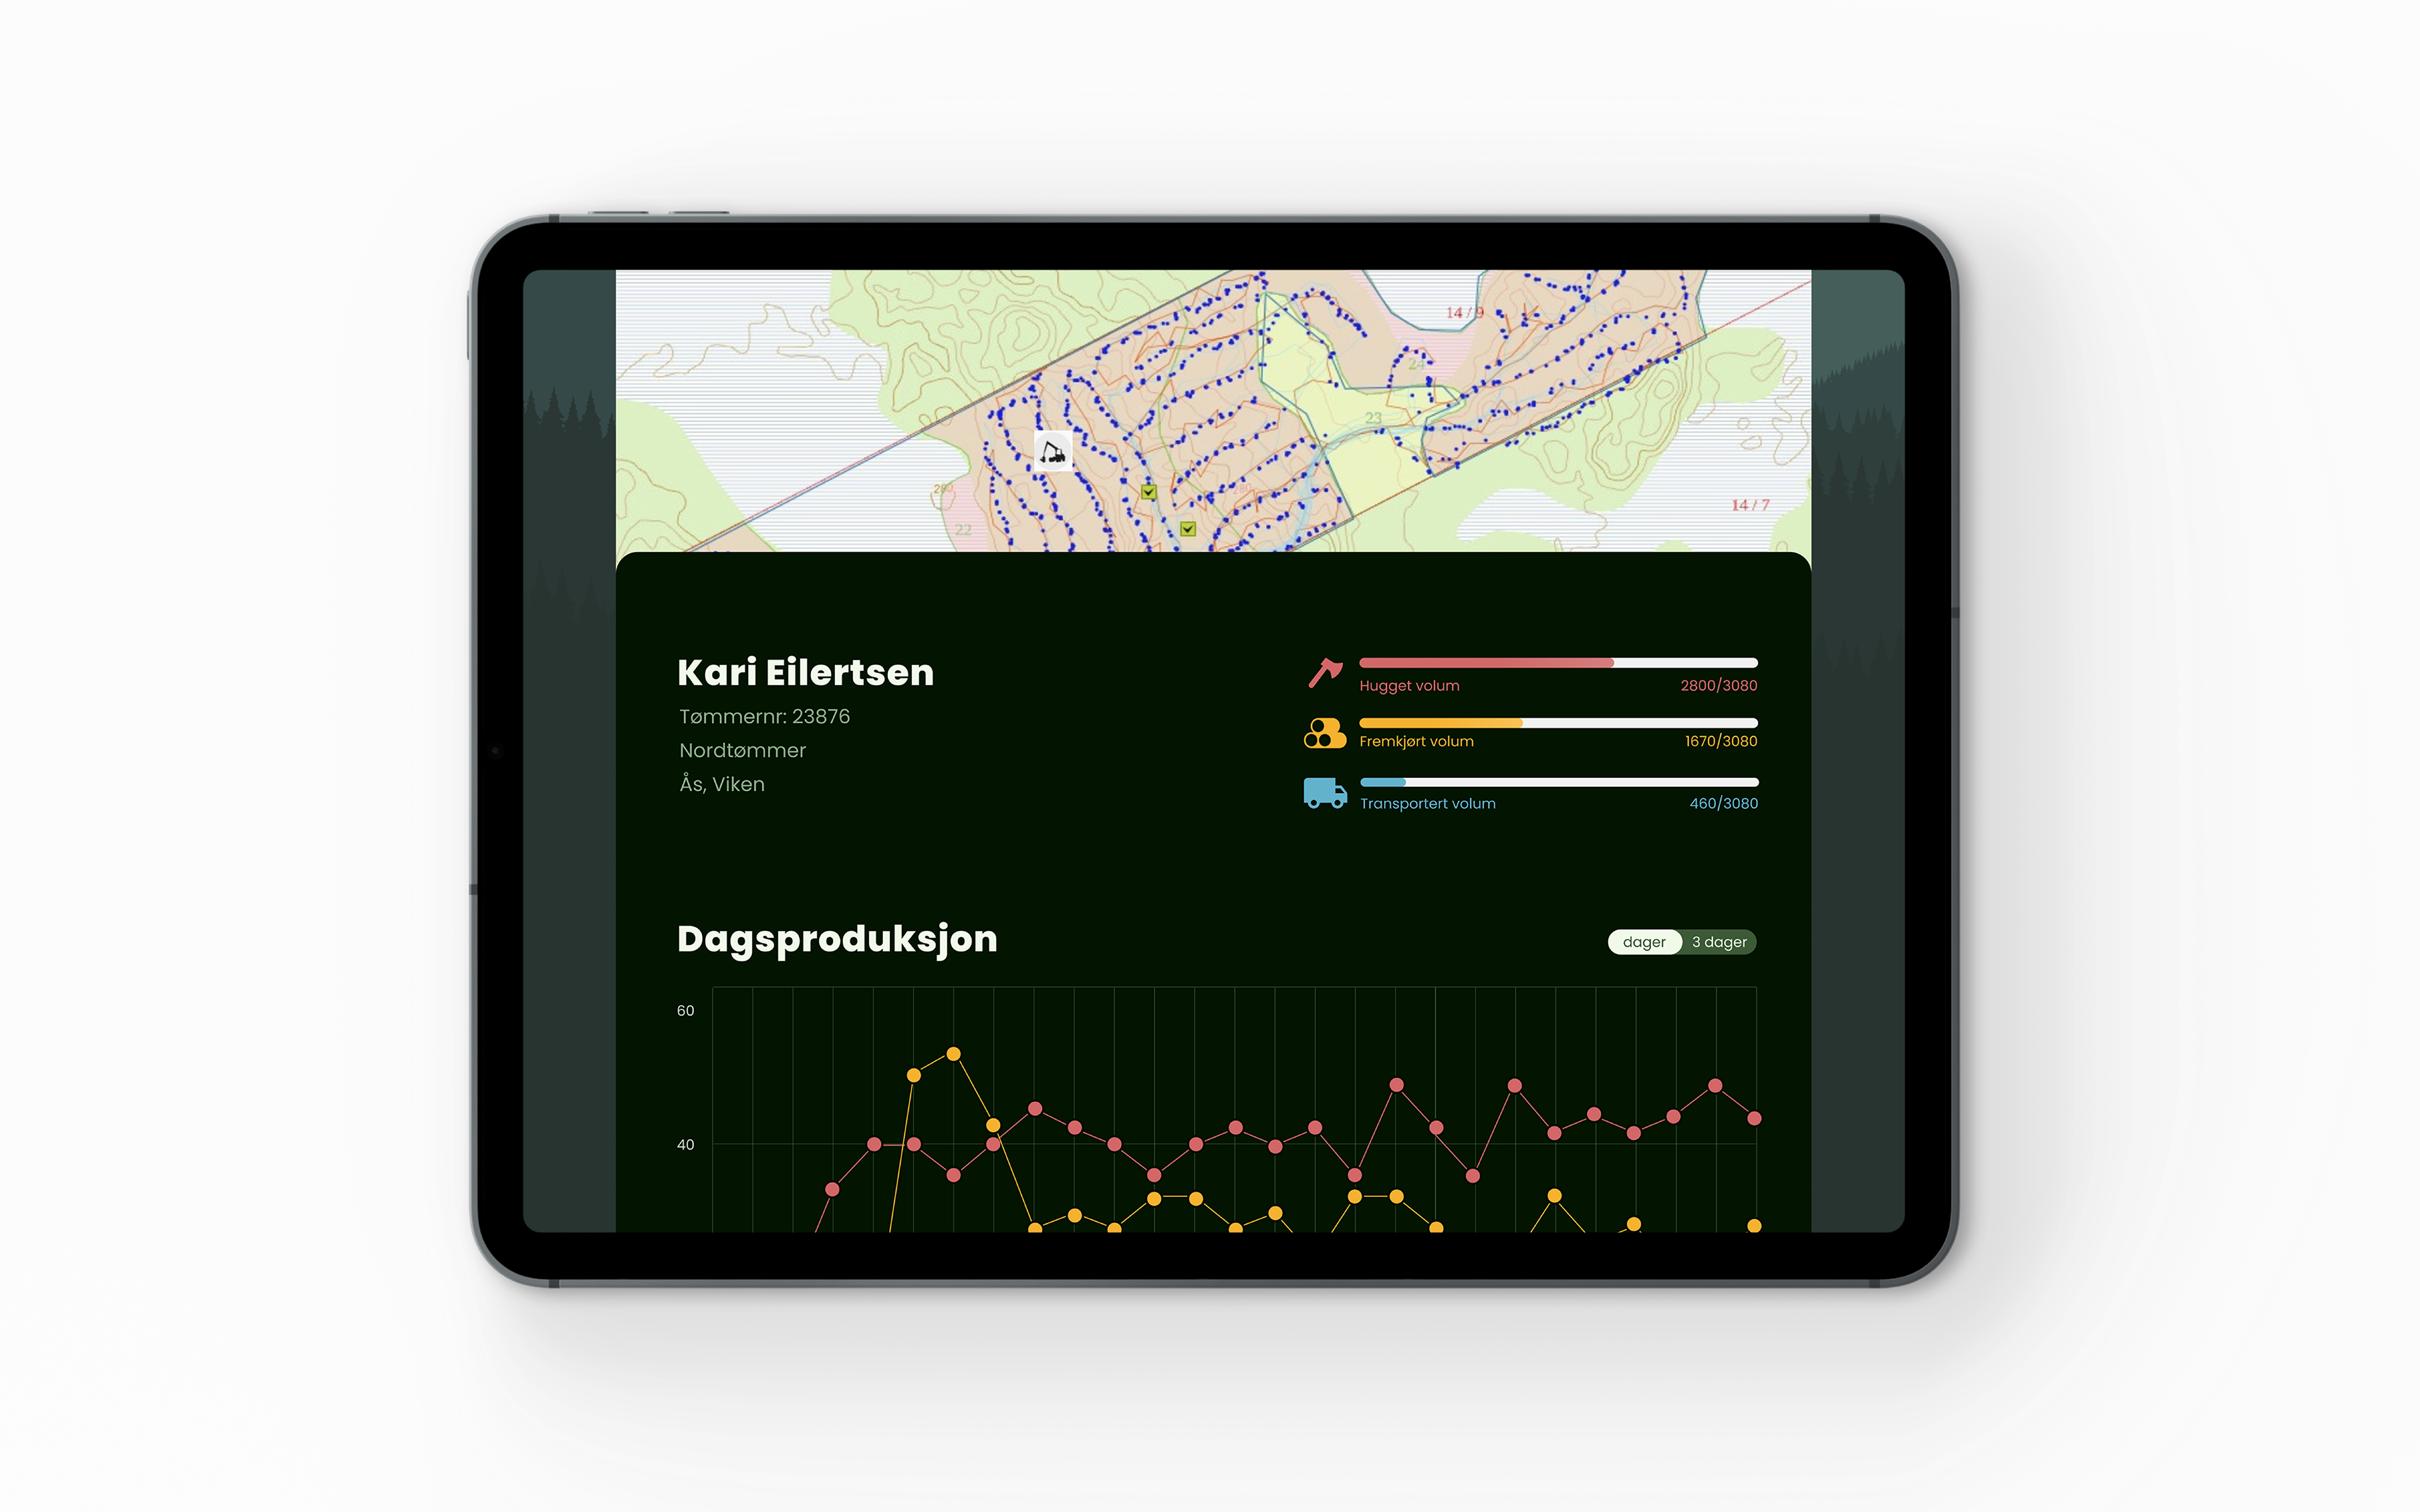
Our brief for my internship at Fink, was to design a new system to collect and visualise logging information for the forestry industry, for the scaleup FeltGis. In a team of two designers and two developers, we designed and developed Hogsten, the first version of the desktop application for FeltGis’ product FeltBoks.
"FeltBoks enables mobile and forestry machinery to communicate. It’s a mini computer that establishes a connection between the forestry machine's computer and a mobile device without the need for software installation."
Where Fink (client: FeltGIS)
When 2021
Team Two designers and two developers
My role UX, user insight, data visualisation, user journeys
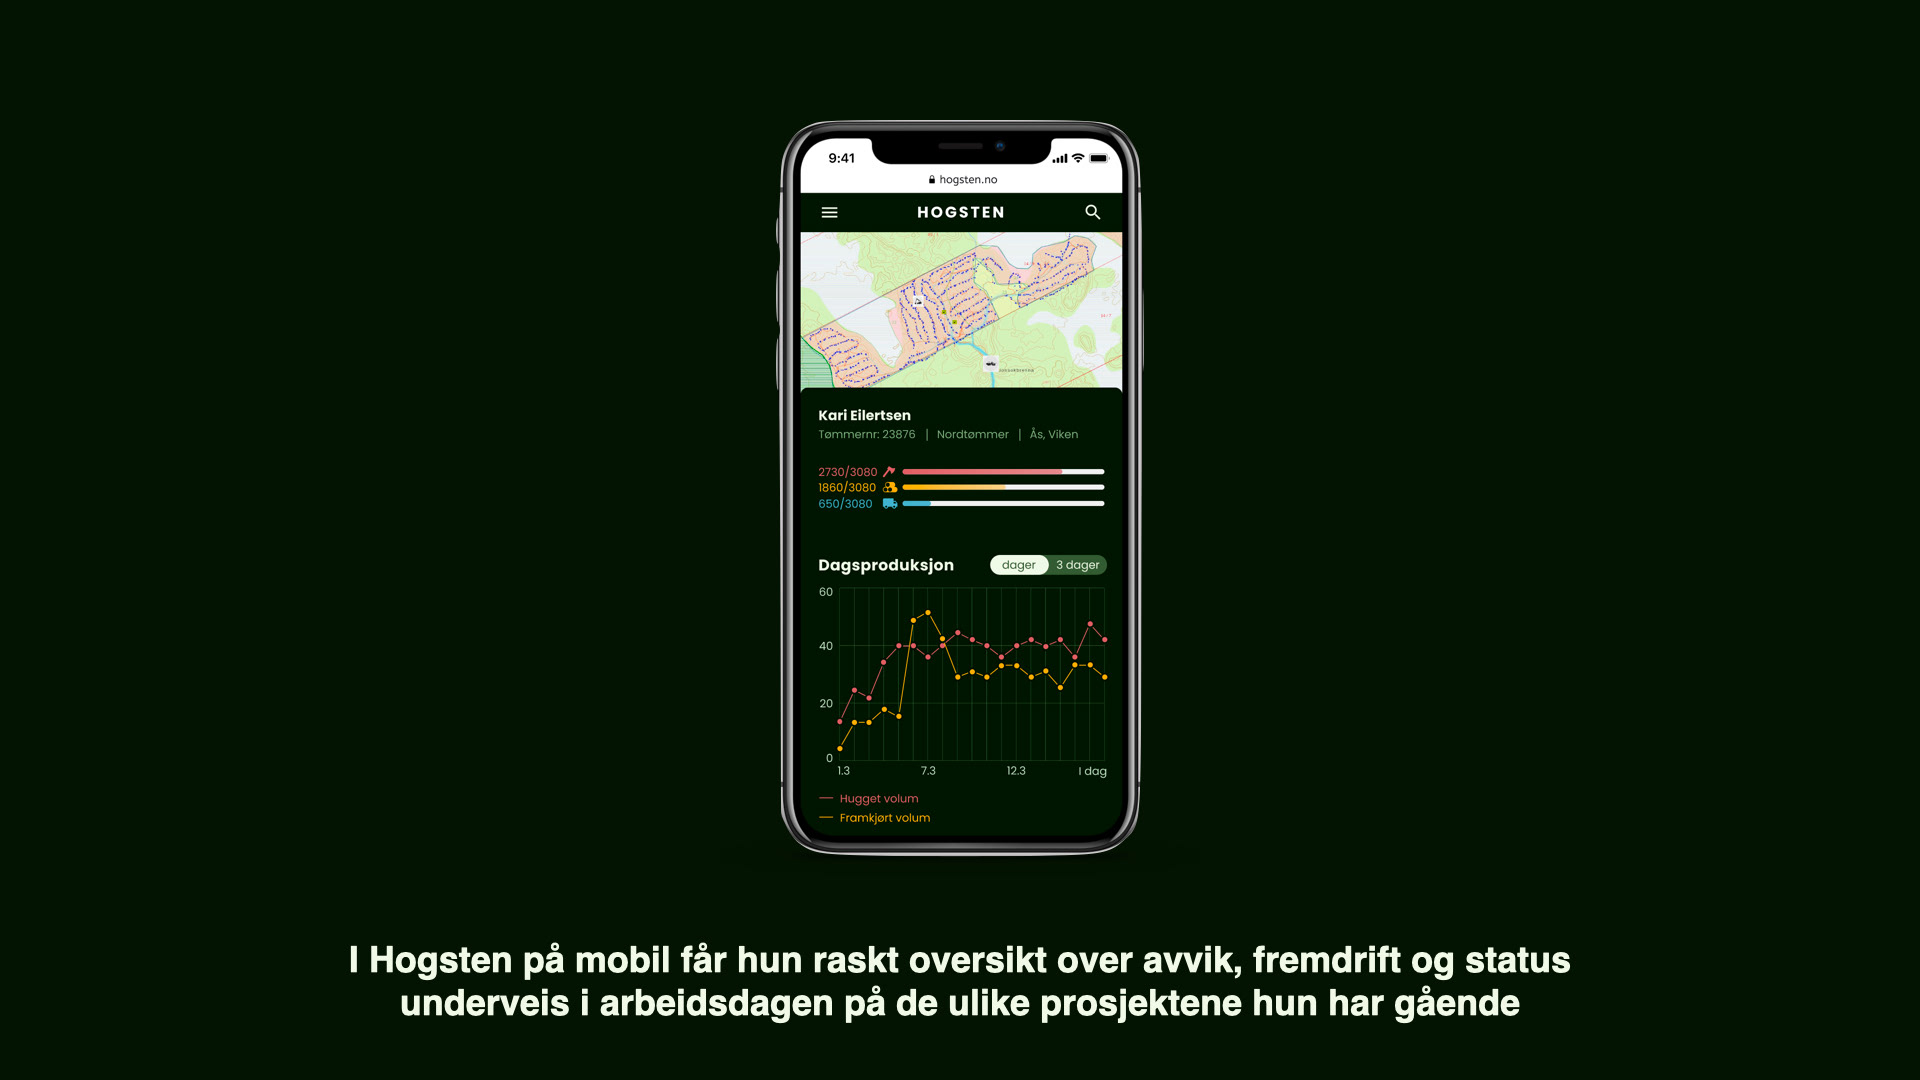
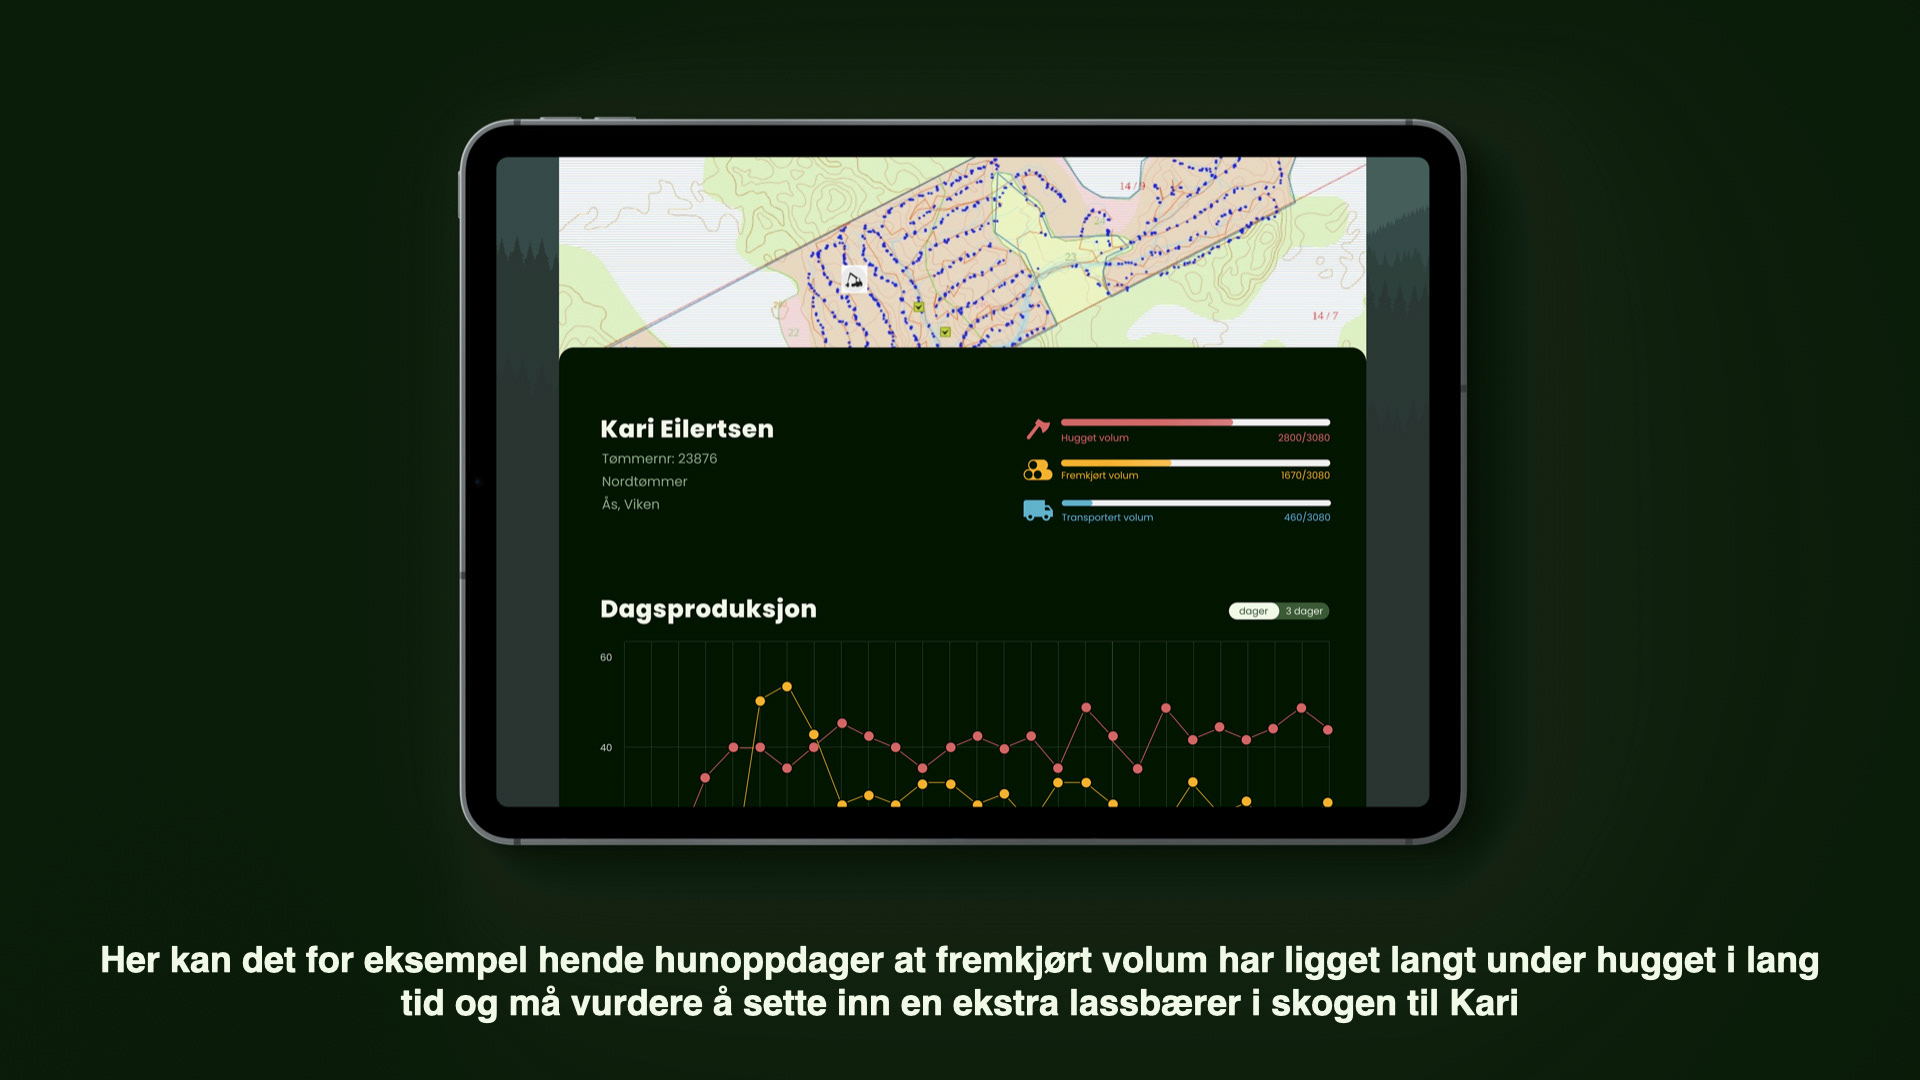
Result Forestry data-visualisation desktop application, still in use today
process
We began by conducting an in-depth analysis of the forestry industry, interviewing key personnel at Feltgis, as well as forestry managers and contractors. This gave us valuable input on the desired features and functionality of the new system, as well as a deep understanding of a field we previously knew nothing about.
Then we kicked the project off by facilitating a week-long design sprint, including the developers as well. Involving the developers in the design work helped build a common understanding of our goal, our different disciplines and strengths.
We employed the double diamond model to structure our work, facilitating rapid iteration and brainstorming of ideas and solutions. This process yielded a diverse array of concepts, which we assessed using personas and tested through interactions with Feltgis and users in the field. Throughout the project, we consistently generated both low-fidelity and high-fidelity prototypes, starting with sketches and progressing to Figma in the later stages. After incorporating user feedback, the final design was refined in Figma, the functionality was developed by our developers, and ultimately it was successfully implemented by Feltgis.
Contribution
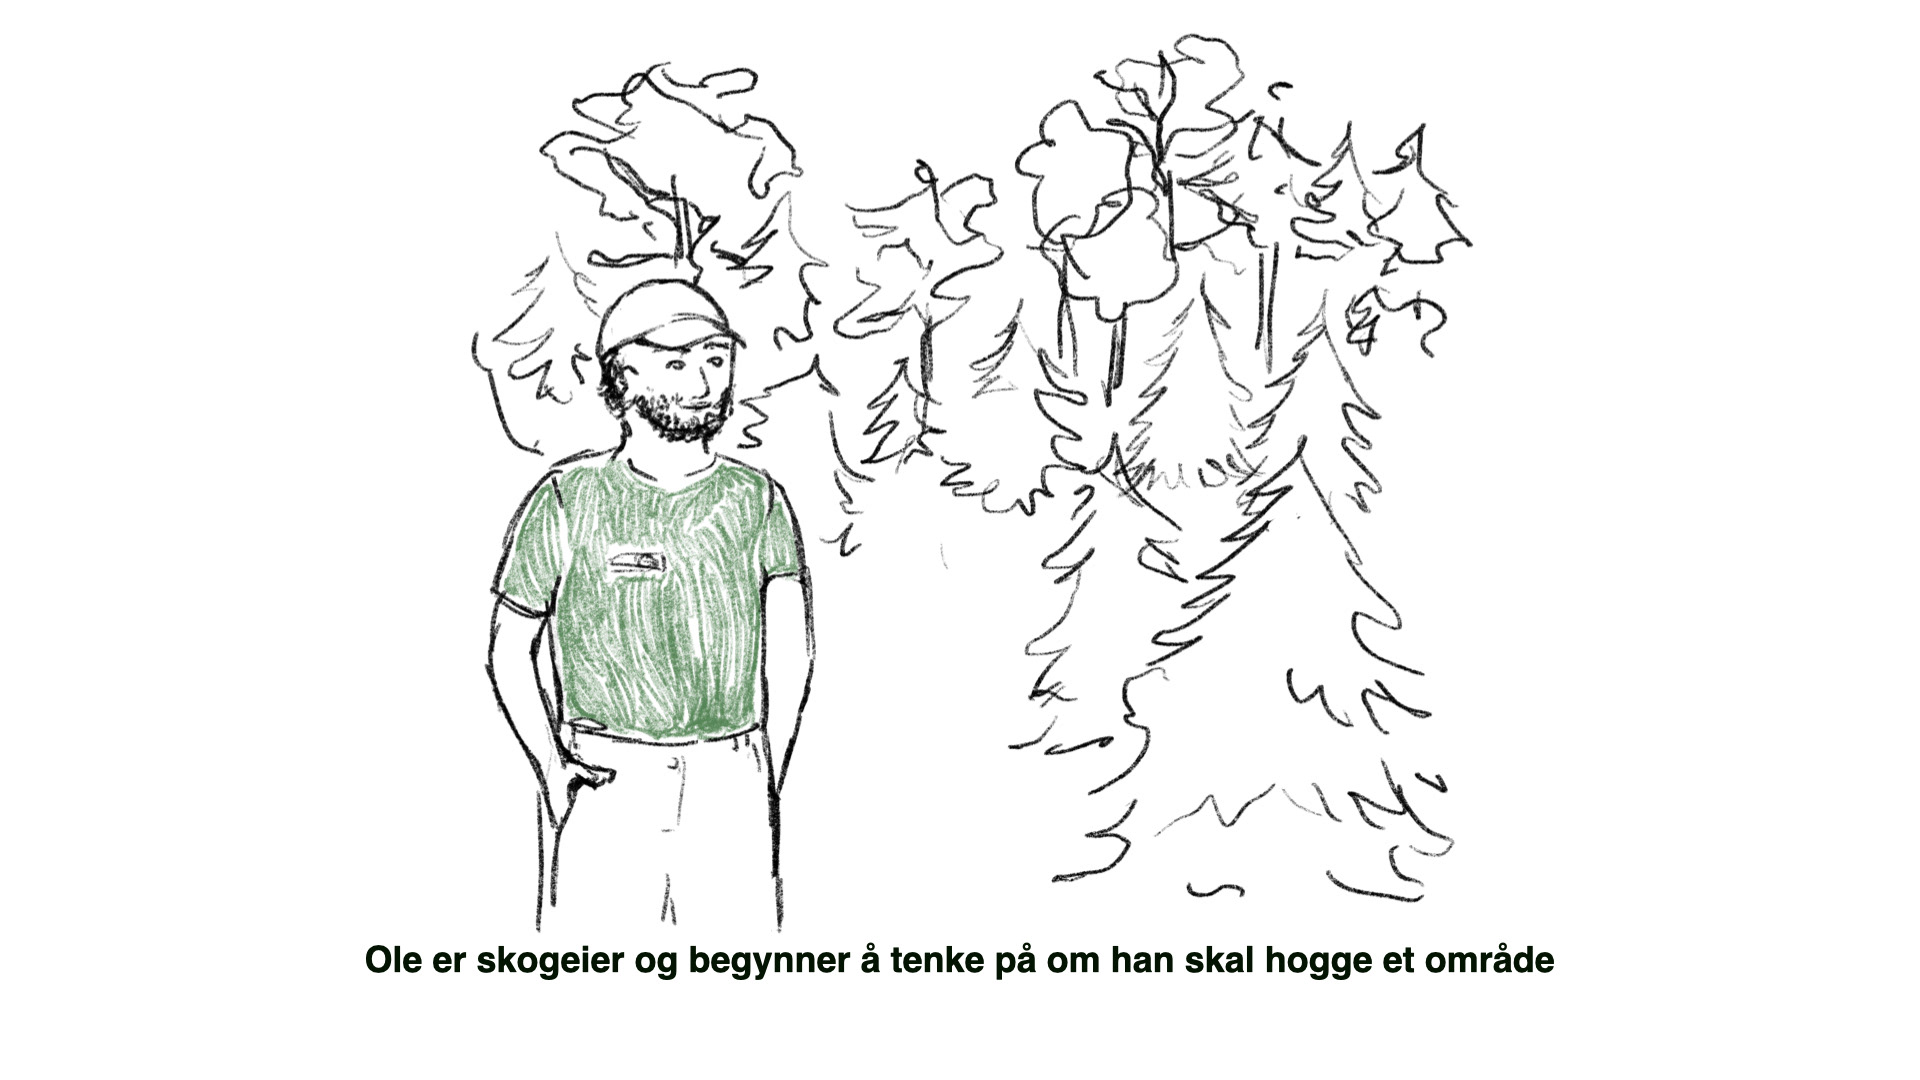
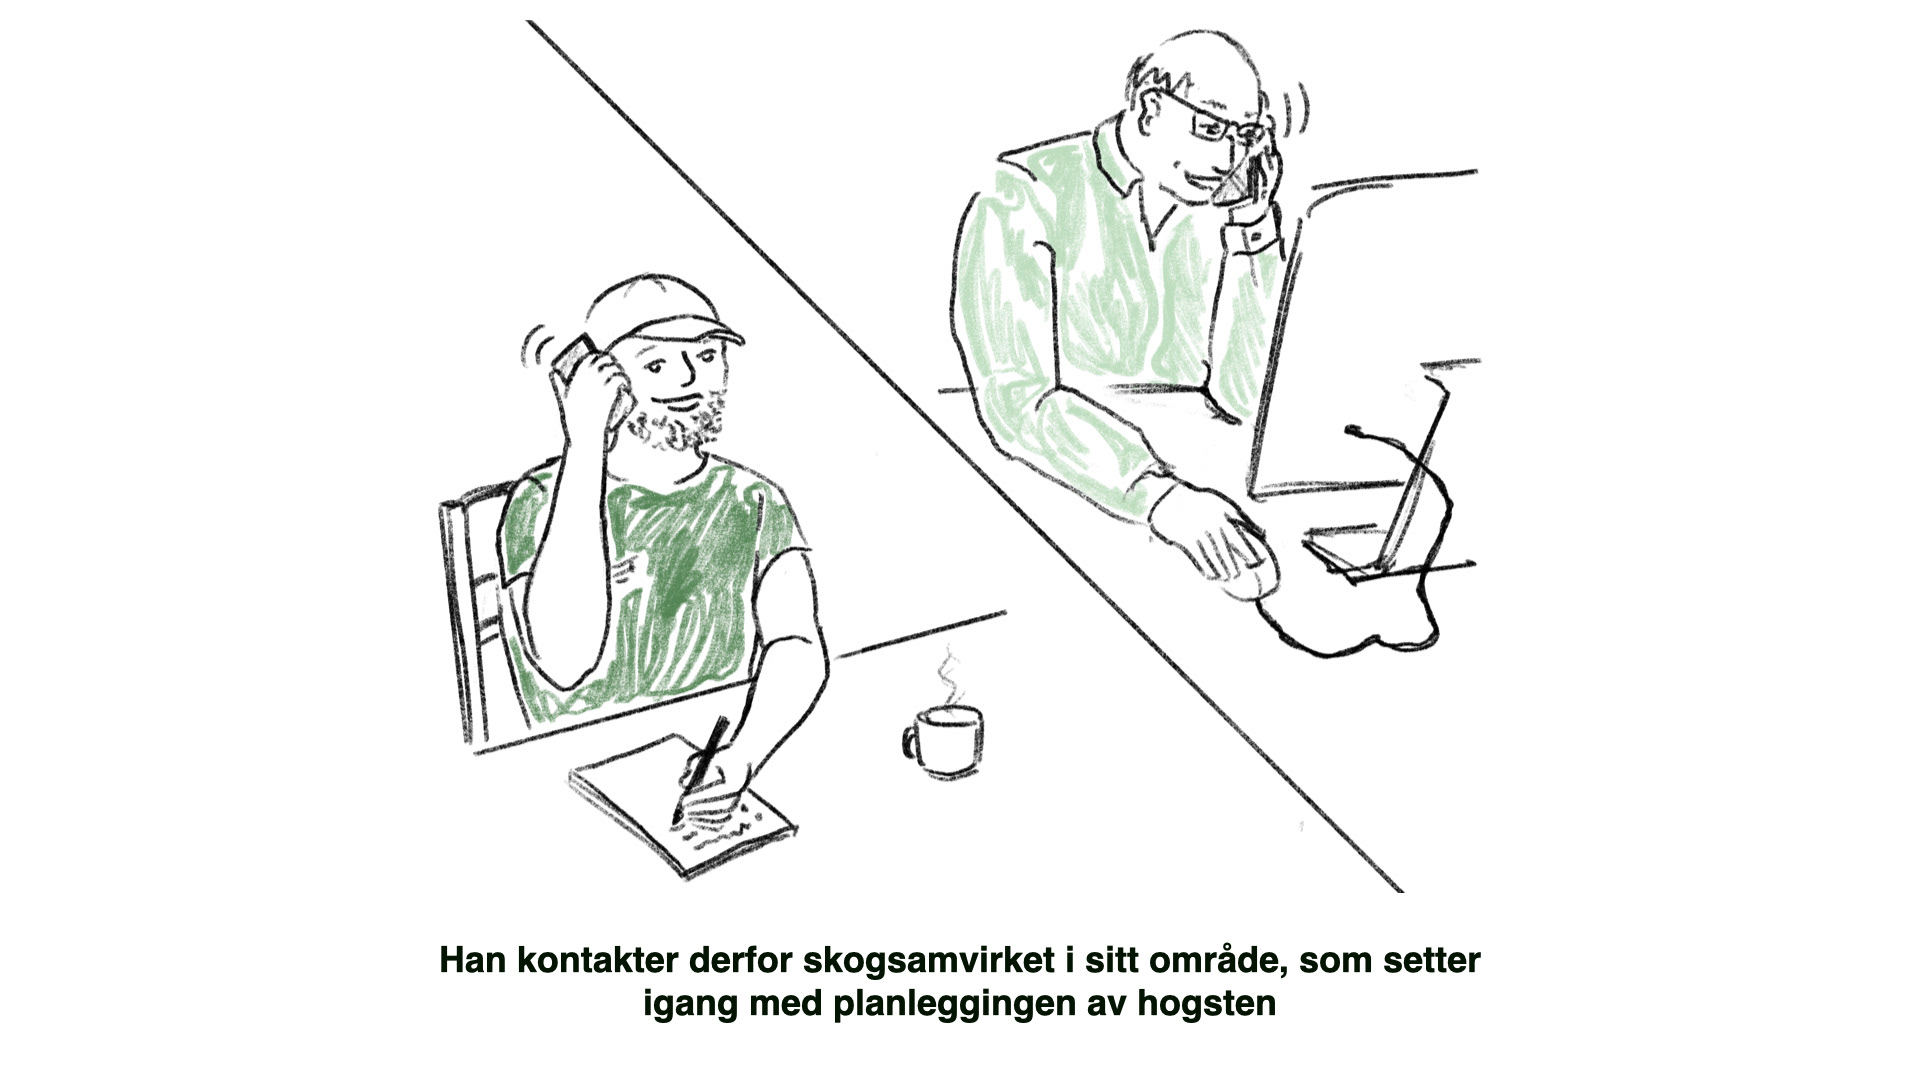
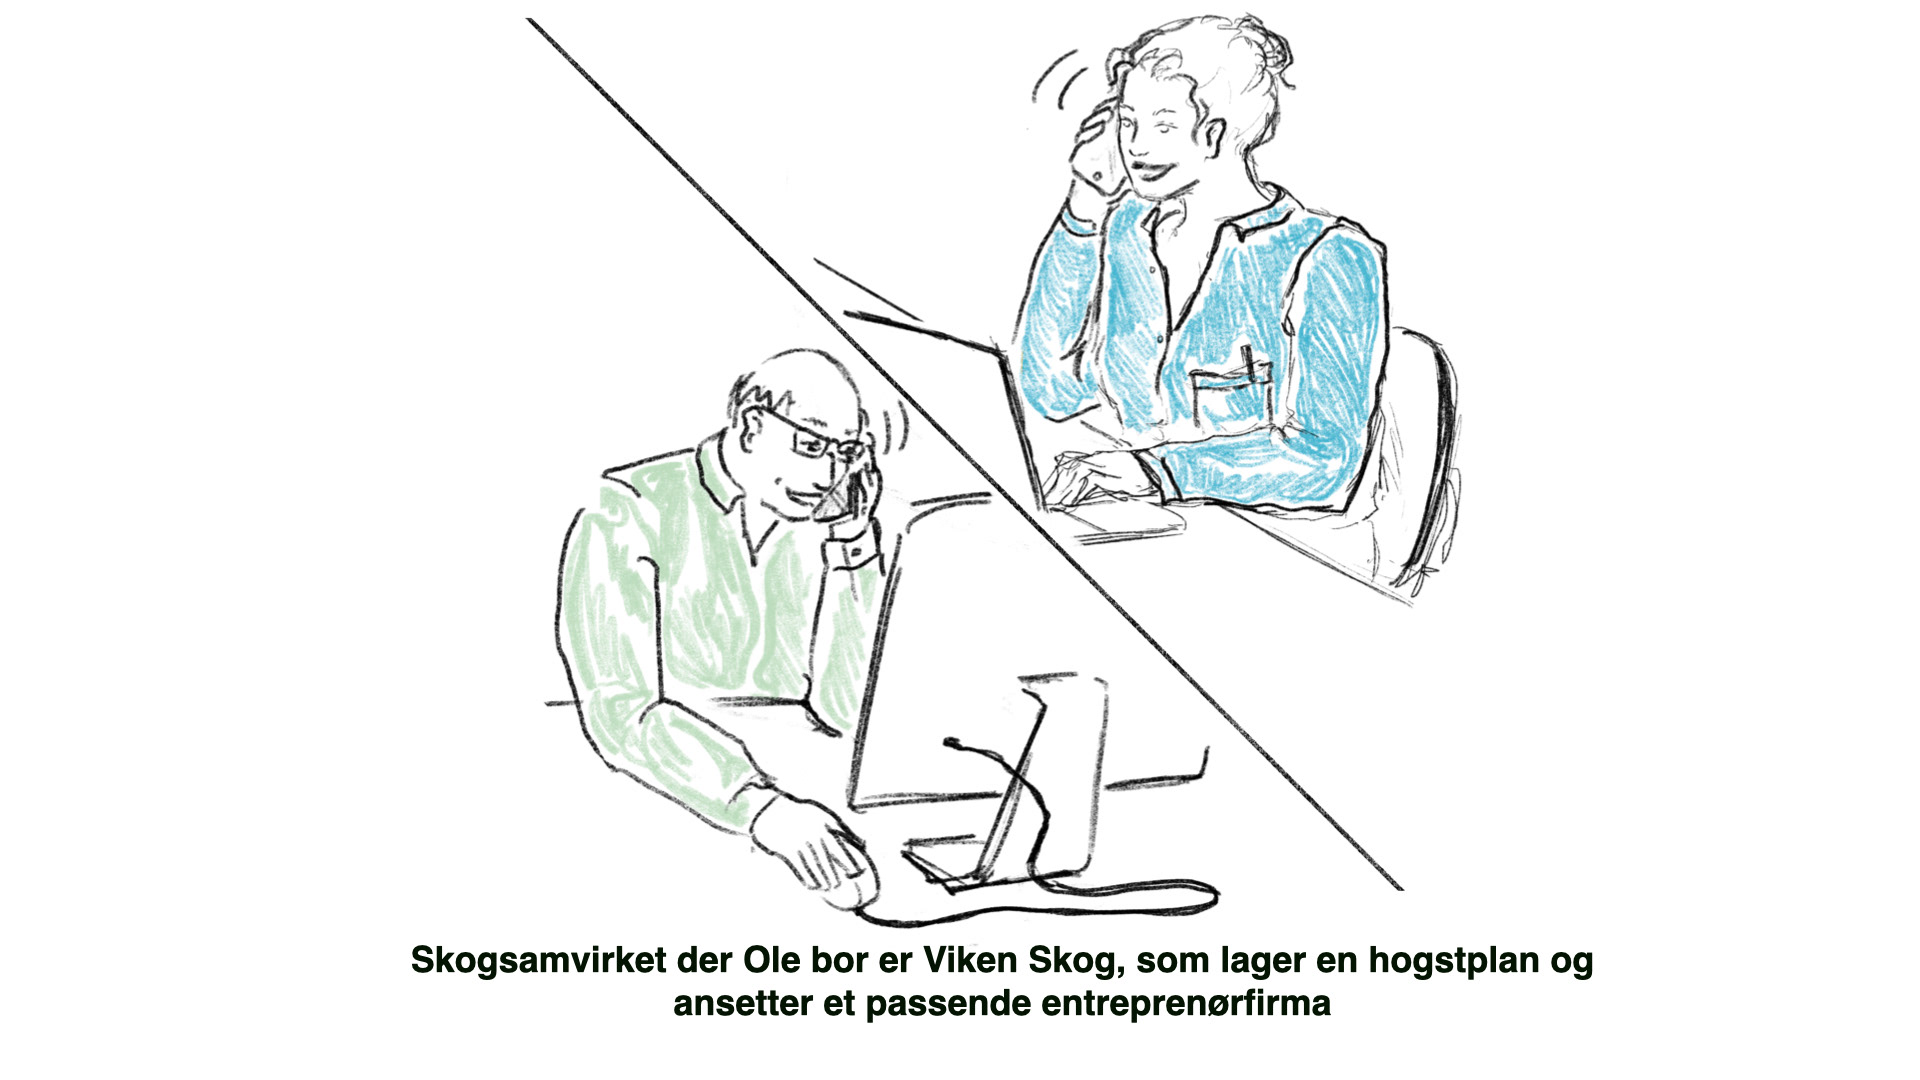
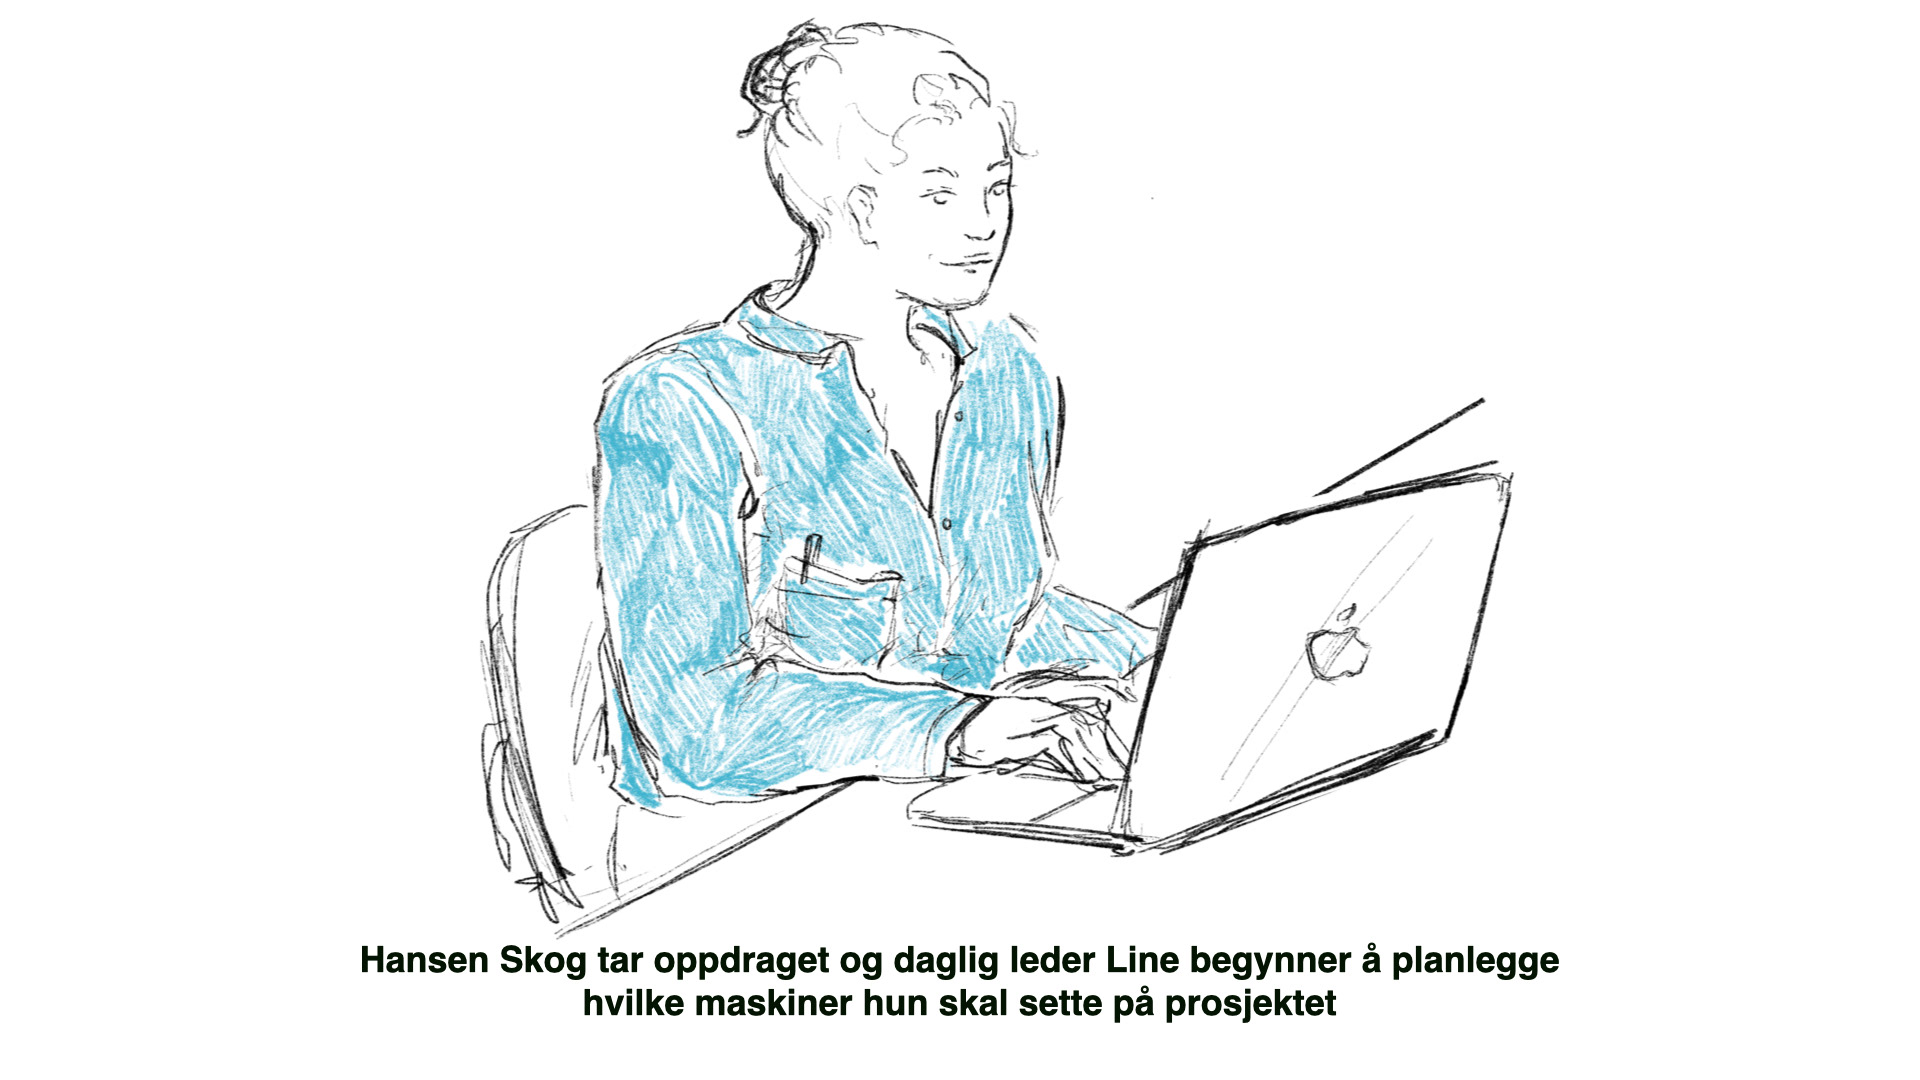
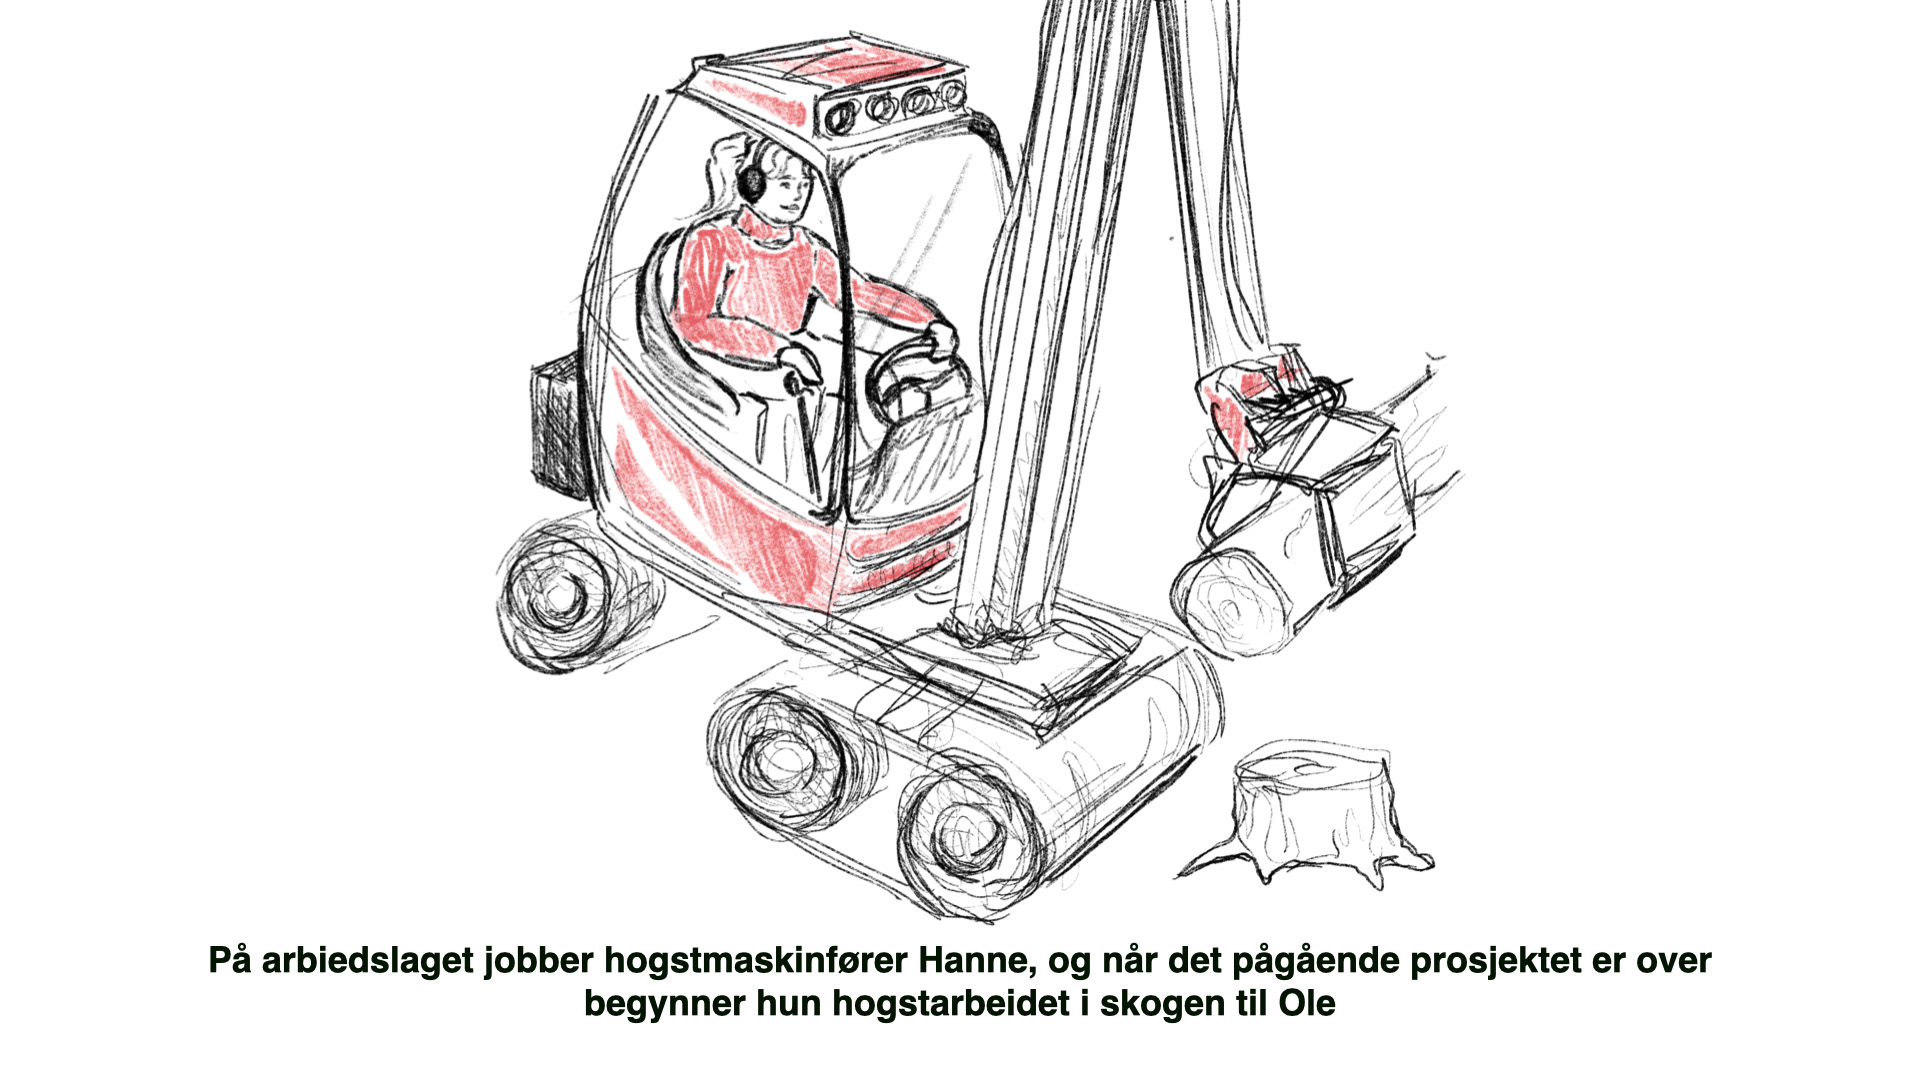
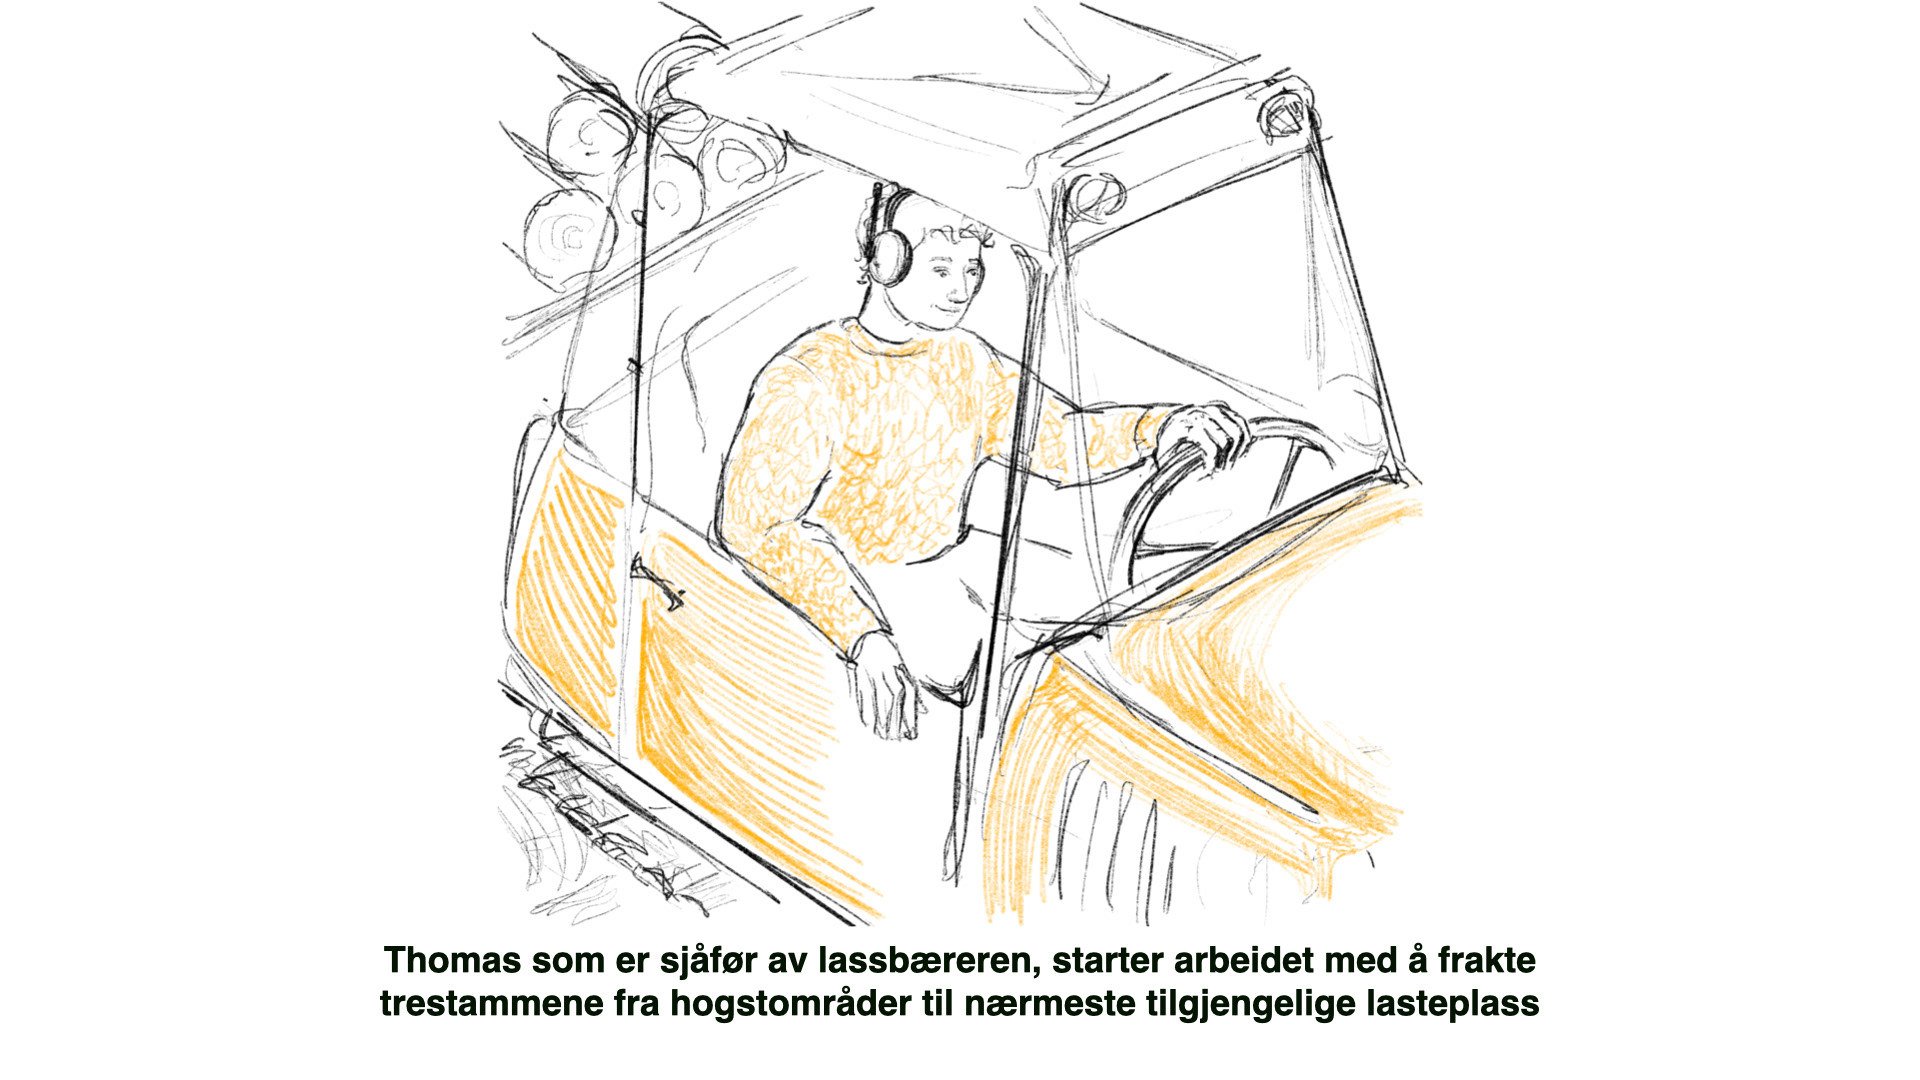
I would consider my most significant contributions to this project to be my efforts in crafting user journeys and stakeholder maps. While I had prior experience with these tools, this project's intricate information flow and diverse array stakeholders, made it clear how important and useful this tool is. By visualising the stakeholder maps and user journeys, we effectively communicated our hypotheses to both users and stakeholders. This process enabled us to identify pitfalls and correct false assumptions at an early stage and raised the quality of the final product.